What sort of council do we need to be – for us and for our residents? How will we get there? How long will it take?
These are some of the questions that the Time to Change survey will help us to answer. And by comparing our data with that of other similar councils, we can get a good idea of what we’re doing well, and what we need to improve.
But before we get there, we need to answer the question, ‘Where are we now?’ Your responses mean we can do just that.
Here are some of the headline facts and figures that came out of the survey:
80.5% of you completed the Time to Change survey.
80.5% of colleagues – that’s 2,696 of you – took the time to complete the survey. This is important for a couple of reasons: (1) it shows just how much you’re all committed to transforming the council; and (2) the high response rate means that our decisions are properly informed and not based on ‘intelligent guesswork’.
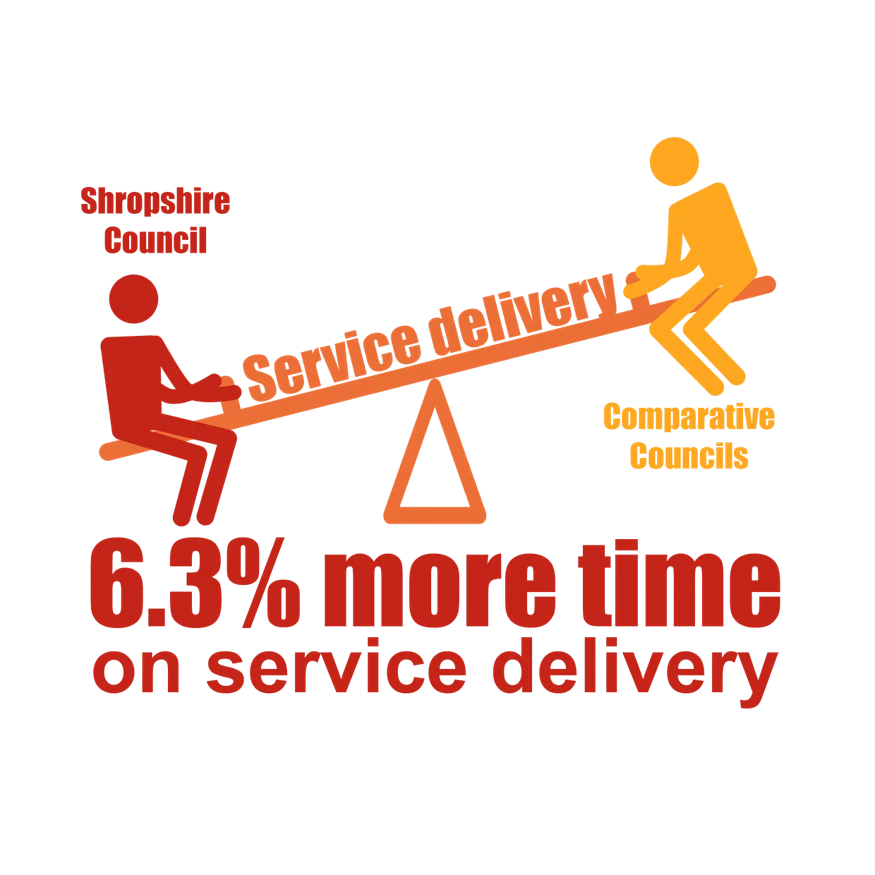
We spend 6.3% more time on service delivery than similar councils.
So if you work a standard 37-hour week, that means you spend around 2 hours and 20 minutes more on service delivery than people doing similar jobs elsewhere. Over the course of a typical 48-week working year (minus annual leave), that suddenly rises to nearly 112 hours – or nearly 14 days extra. Multiply that by 2,884 full-time staff, and we’re looking at a massive 40,335 extra hours. That feels like a lot of additional time!
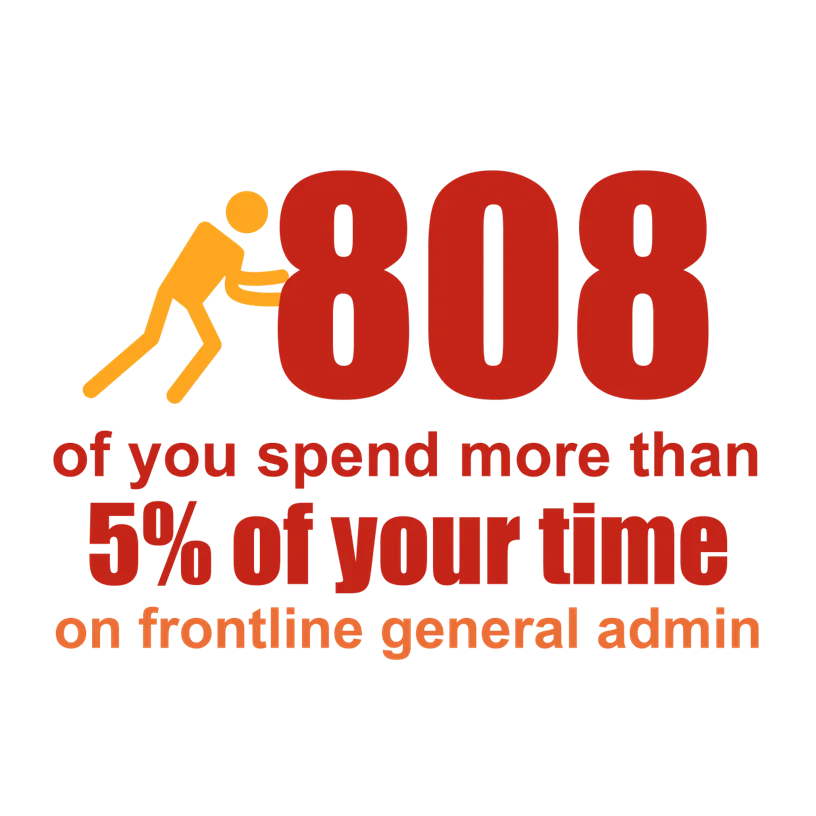
808 of you spend more than 5% of your time on general administration.
Again, that’s around two hours a week, every week, every year. Unnecessary admin was a key issue in the survey and in your individual responses, and the figures certainly back up your concerns. That’s why we’re looking at ways to reduce the admin burden, so that you have more time and mental space to do the jobs you want to do. Again, it’s all about reducing treacle.
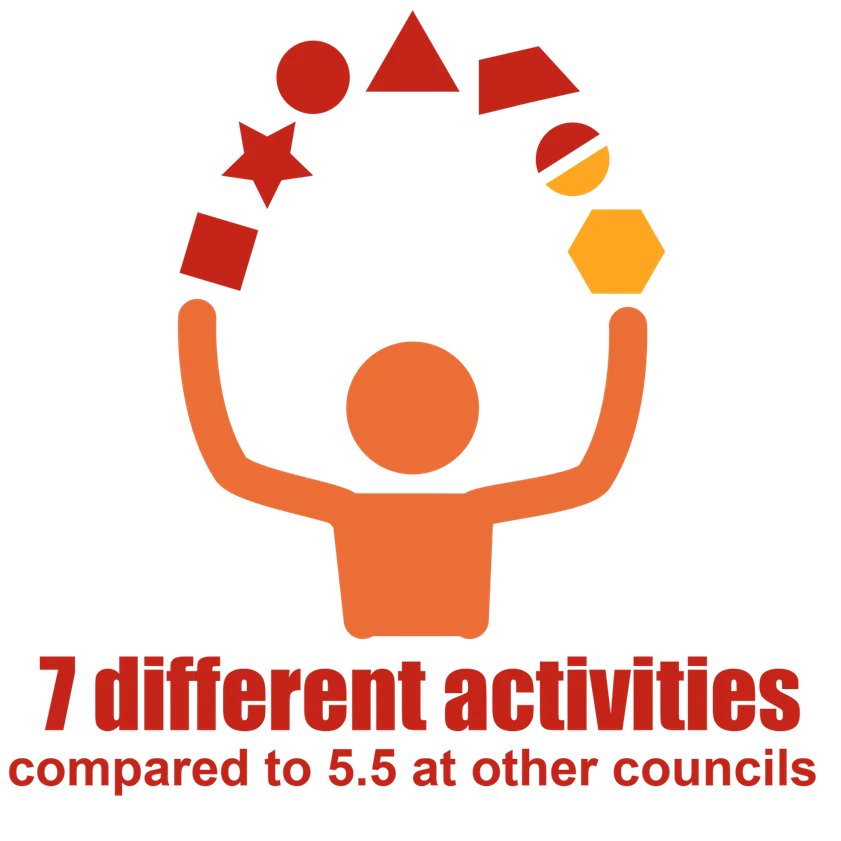
On average, you perform 7 different activities compared to 5.5 activities at other councils.
So if you’re doing such a broad range of work, that can mean many different things and have many different reasons, but it could be telling of how we operate as an organisation and that functions are spread across different individuals and teams rather than focused into professional groups.
We spend 7% less time on corporate strategic and support services than other councils.
Is this why many of us feel like we’re constantly spinning plates? We have been an incredible council and getting on and delivering; however, these figures suggest that we may need to spend more time planning and thinking, so that when it comes to the doing, we know exactly what we need to do.
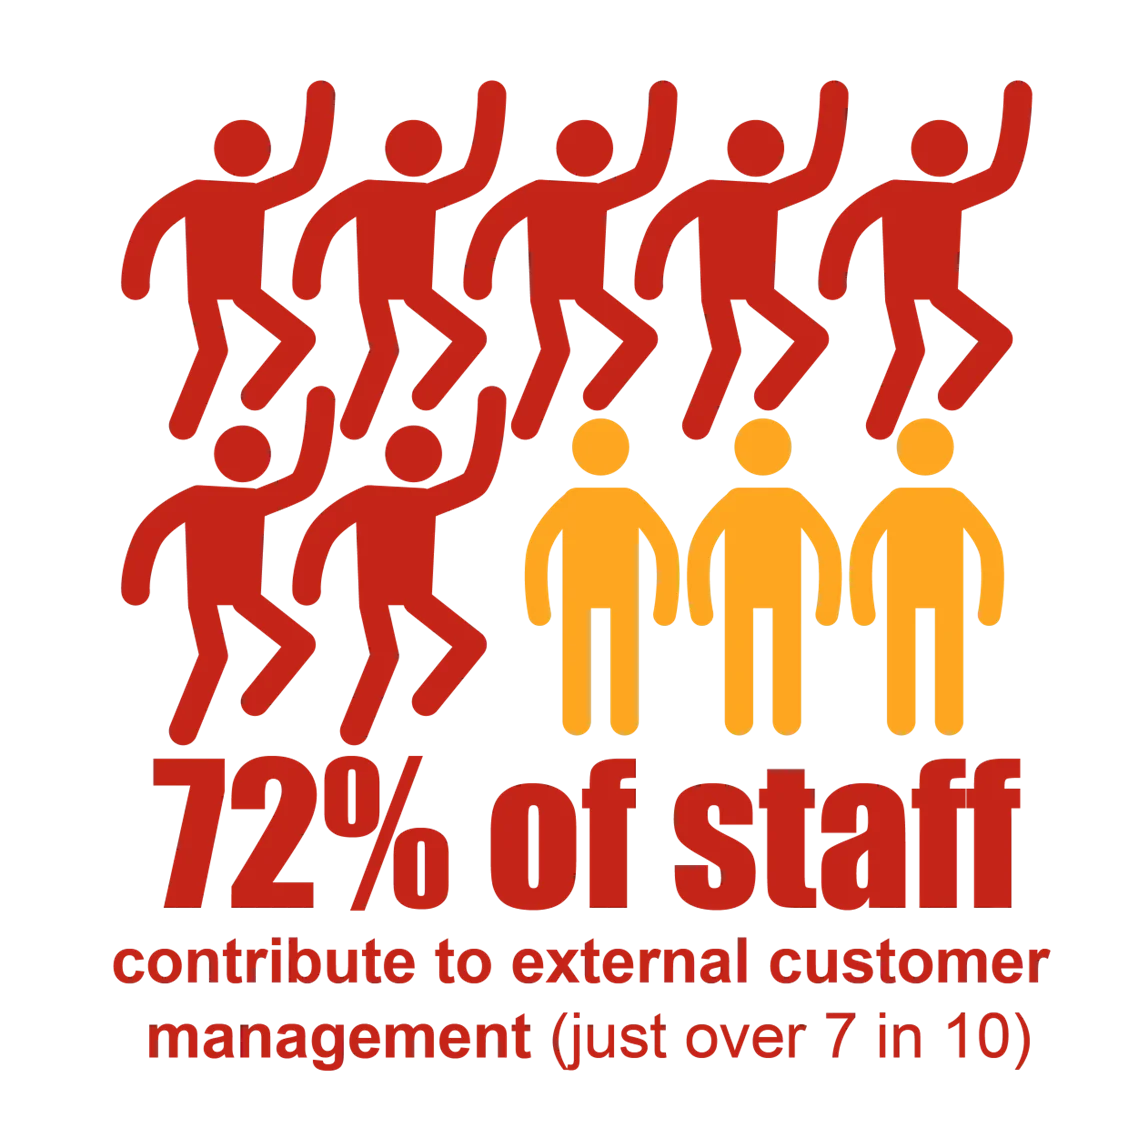
72% of roles contribute to external customer management.
In other words, 2,563 of you are engaged with our customers and help manage their experience. With many of our services being dependent on providing customers with the outcomes they need, this may feel right, but it also feels significant! Is there duplication across roles? Does it link to the different activities outlined elsewhere in the results and so does it mean we need to refocus roles and maybe use technology to help? Again, this is all part of the wider conversation we need to have.